Garmin replied to my support ticket to say that they were working on a patch to fix my problem and they’d inform me when it was ready. Then yesterday when I plugged my Fenix into the computer it did install an update, but I wasn’t sure if it was “the one” because they didn’t inform me. I decided to take both the Fenix 6X and the Forerunner 920Xt out on the canal to make another comparison.
My impression while paddling is that I didn’t see any ridiculous speeds this time, but the Fenix was reading a little higher than the 920Xt much of the time. Also, by the middle of the paddle the Fenix had the distance about 20 meters further, and by the time I finished it was nearly 40 meters.
I threw both FIT files into DC Rainmaker’s Analyze tool and found a few things.
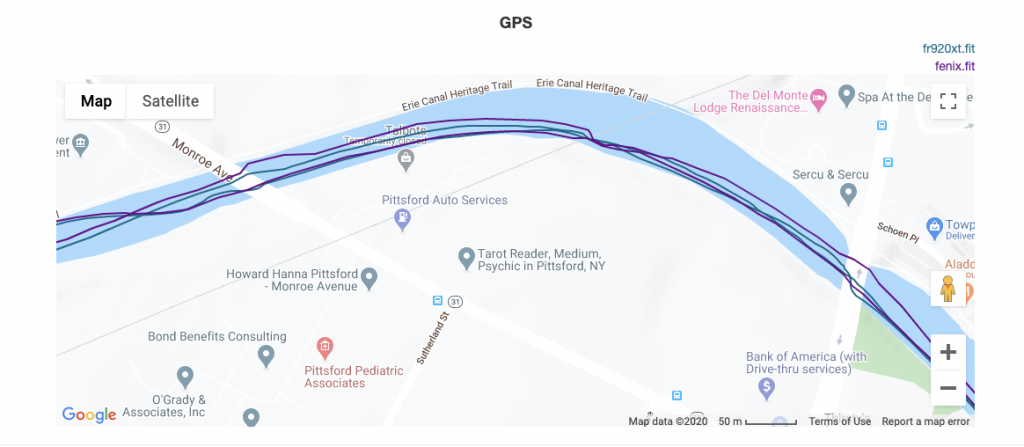
The first thing you see is that both tracks go a bit wonky around these bridges (and others not shown here). The purple line is the Fenix, and the blue line is the 920Xt. When I paddle downstream I tend to stick towards the middle of the canal (the upper lines) and when I return I tend to hug the inner shore. I can assure you I didn’t make a sudden jog to the left bank at Monroe Avenue as shown in the upper Fenix track or a sudden jog to the right shore as shown on both tracks. Same with the bridge at Schoen Place – the Fenix track shows me way too far north and the 920Xt track shows me making a sudden jog to the south, neither of which are correct. Overall the 920Xt seems to do a better job of showing my actual track, but the Fenix isn’t terrible.
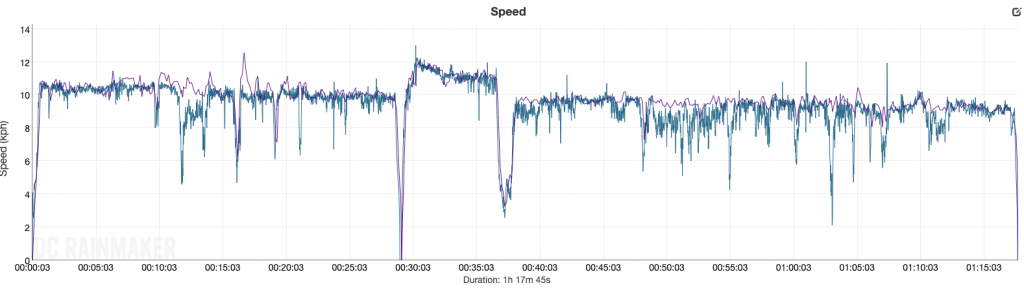
Overall, it looks like the Fenix speed has been more aggressively smoothed, or maybe it’s not sampled as often. There’s a weird peak at the 16 minute mark where the 920Xt is showing 10.1 km/hr and the Fenix is showing 12.6, but otherwise they’re close. And not surprisingly, the spike occurs while passing under another bridge, State Street, which is also a steel bridge with big trusses.
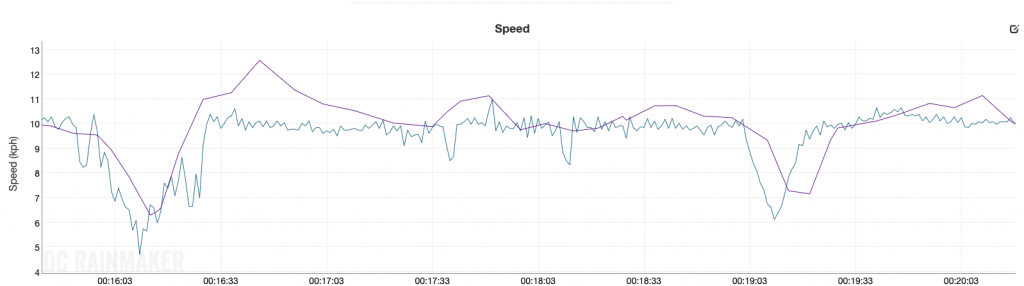
When I zoom in you can see that the 920Xt speed is changing much more frequently than the Fenix. Come to think of it, I remember setting my 920Xt to sample every second – that might be something I need to do for the Fenix as well. You see a similar smoothing effect (or lack of sampling frequency effect) on heart rate even though they’re both paired to the same Wahoo TIKR heart rate strap.
One thing everybody should know about GPS watches is that their altitude information is terrible. And these two watches are terrible but different.
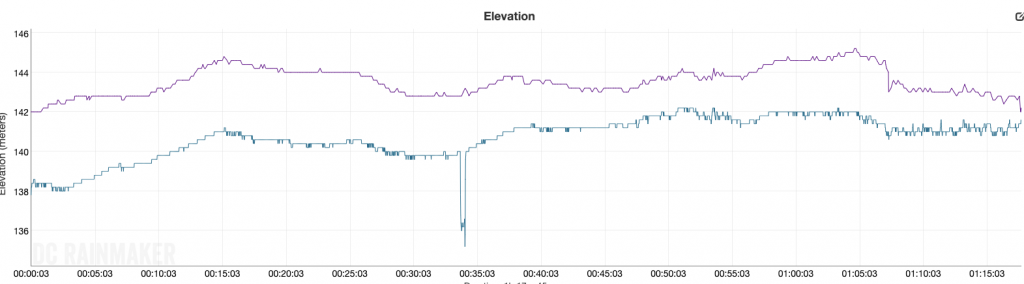
The Fenix is consistently higher elevation that the 920Xt, but with similar shape of ups and downs (on a practically flat canal). Only 3 or 4 meters elevation difference between them most of the time. I can’t find any obvious cause for the weird dip at around the 33 minute mark on the 920Xt as I’m nowhere near any bridges nor am I particularly close to the concrete walls of the “Washing Machine”. But that’s ok, I usually remember to click “Elevation corrections” on Garmin Connect and Strava after it’s uploaded. I think what they do is correct your elevation to what a digital elevation map says your elevation should be at each location point.
At this point I’m just about ready to declare myself ready to use the Fenix for normal paddling. I’ll do a few more head to head tests first, though.